Local rankings are a dying metric, especially with
the fluctuations of Pigeon. So why not start reporting on metrics that
actually matter?

If you work in Local SEO, you’re already familiar with the Pigeon update and the crazy effects it’s had on local search results. It’s painfully obvious that the rankings are still fluctuating – but maybe that’s a good thing.
Many SEOs have been calling for an end to monthly ranking reports for quite a while now. Unfortunately, clients still see ranking reports as the best indicator of SEO success.
Now that Pigeon has caused havoc with local rankings, we’ve got a huge opportunity to take advantage of the flux and educate our clients that rankings don’t equal success. All of the Local SEOs can band together, rise up, and show our clients better reports with metrics that really matter to the bottom line.
5 Local SEO Metrics You Should Focus On Instead Of Rankings
Contrary to popular belief, your monthly reports don’t have to be complicated and show tons of data. In many cases, you could ditch your complicated, 10-page report and instead provide two simple pages of actionable data.
Here are 5 metrics that you should be tracking and including in your report to show the success of your Local SEO campaigns:
1. Organic Traffic

You’d be amazed at how many SEO reports are out there that don’t show organic search traffic! Hopefully you’re already including this in your reports, but if you’re not, stop reading and go add it in immediately.
There are two ways to get to this data. The first is to go to Acquisition > Channels, and then look at “Organic Search.” This is the easiest method, but not necessarily the most accurate by default – smaller search engines are sometimes not included within “Organic Search” (they’ll instead be counted as referrals), or you might have Google referrals that you’d like to include within your organic search traffic. (Note: if you’re using Universal Analytics, you can now identify any referrers as search engines, but you have to set your analytics up in that manner.)
If you’re not using Universal Analytics but know there are sources you’d like to count that wouldn’t show up under the standard Organic Search report, you can check your numbers manually. Navigate to Acquisition > All Traffic and scan the Source/Medium column for organic search sources.
Pro Tip 1: If you’re going to use the second method, you can build a simple spreadsheet that counts the results for you. Create a range that lists all of the possible organic traffic sources that might be listed, then set up a column that will use VLOOKUP to check your traffic sources against the list. Export the list of traffic sources, then paste them into the spreadsheet, and the totals will be automatically calculated.
Pro Tip 2: Instead of simply showing monthly search traffic in a graph or chart, compare your organic traffic to last year’s organic traffic. Comparing month-to-month isn’t accurate in many verticals due to seasonality, but when you compare year-over-year, you get a better view of the traffic trends.
2. Organic Landing Pages

You know which pages are optimized for which keywords. Instead of providing a report that shows how your pages are ranking, you should report on which pages are actually receiving organic search traffic.
Go to Acquisition > All Traffic, then select “google/organic” to isolate the visits from Google (or whichever search engine you’re analyzing). Use the secondary dimension drop down to show “Landing Page” (under Behavior) and you’ll have a nifty little report that shows which pages get actual visits from Google.
Instead of showing what keywords you’re ranking for, you’re showing which pages are actually getting search engine traffic. Since you know which keywords each page is optimized for, you know which keywords are bringing you the most traffic. If your local targeting is working, you should see increased visits to SEO landing pages over time.
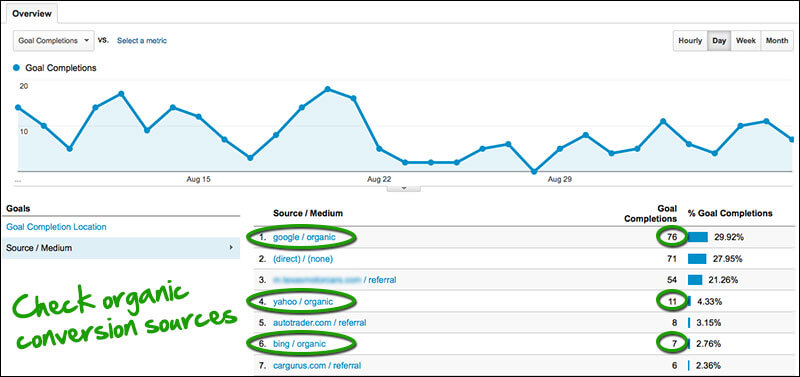
3. Organic Conversion Sources

This is another one that you’d think would be in every SEO report — yet it’s missing from far too many. When your client wants to know about the ROI of SEO, they’re asking you to show that the money they’re spending on your services is making a difference to their bottom line. Nothing speaks to the bottom line more than hard numbers on how many leads your client gets.
Navigate to Conversions > Goals > Overview. If you scroll down, the default view shows the Goal Completion Locations, but if you click the “Source/Medium” option just underneath, you’ll see a list of the top 10 sources for goal conversions. Track your organic sources and make this one of the key metrics in your monthly report.
Pro Tip: Create a custom report in Google Analytics to show only organic search sources for goal completions. Again, you can export the results and drop them into an Excel sheet that automatically totals the numbers.
4. Google My Business Impressions

Google Webmaster Tools will give you impression data across keywords, but if you log into your Google My Business (GMB) dashboard, the Insights data will show impressions for just your GMB listing. Keep in mind that the numbers shown are approximate — just like Webmaster Tools, the data is filtered and meant more for a “big picture” view than exact numbers. Even so, you’re still able to see trends over time.
Since map pack or Carousel views don’t necessarily lead to website visits, it’s important to show your client how their GMB listing is working for them. They might be getting phone calls or physical visits from map pack views, which you can’t track in your reports – so showing an increase in GMB impressions over time helps to prove ROI.
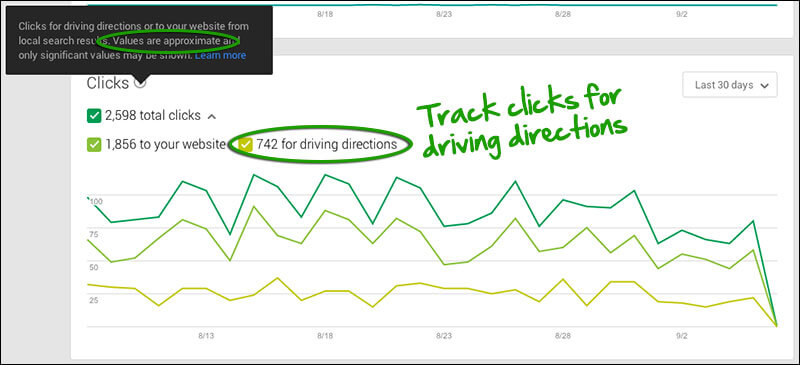
5. Clicks For Driving Directions

Again, values are approximate here, but it’s definitely a metric that your clients will love. If a user is clicking over to driving directions, you know that they’re planning on a physical visit — and this is huge for local business owners. Track the number of driving directions clicks over time to show an increase as your Local SEO efforts give your client more visibility in more searches.
You can even look at some (extremely general) numbers of where the clicks for directions came from:

Now that Google is moving in a hyper-localized direction, this can help to show where your customers are coming from. If you’re targeting specific neighborhoods or suburbs of a metro area, you should be able to see an increase from those zip codes when you track these numbers over time.
Bonus Metric: Manual Phone Tracking
We all know that call tracking numbers are awful for local search, but we’ve worked with several clients who’ve opted for manual tracking and had great success. They’ve trained their staff to ask a simple question at the end of every call: “If you don’t mind, how did you find our number today?”
Almost 100% of the time, the caller is happy to tell them where the call came from. The numbers are collected and relayed at the end of the month, and we’re able to include inbound call data along with form conversions. Again, if your Local SEO efforts are successful, you’ll see an increase in calls from “the Internet” over time.
Deliver Reports With Metrics That Matter
Again, your reports should deliver metrics that matter to your client’s bottom line – not pages and pages of data that they don’t care about. We should use the Pigeon-induced insanity of local ranking fluctuations to educate our clients and prove to them that they don’t need ranking reports to prove ROI. Better reports with actionable data will result in happier clients, which means job security for all of us.
Source of: One Positive Pigeon Result: We Can Finally Ditch Ranking Reports


0 comments:
Post a Comment